Monitoring
What Monitoring metrics can be seen for my Virtual Machine (VM)?
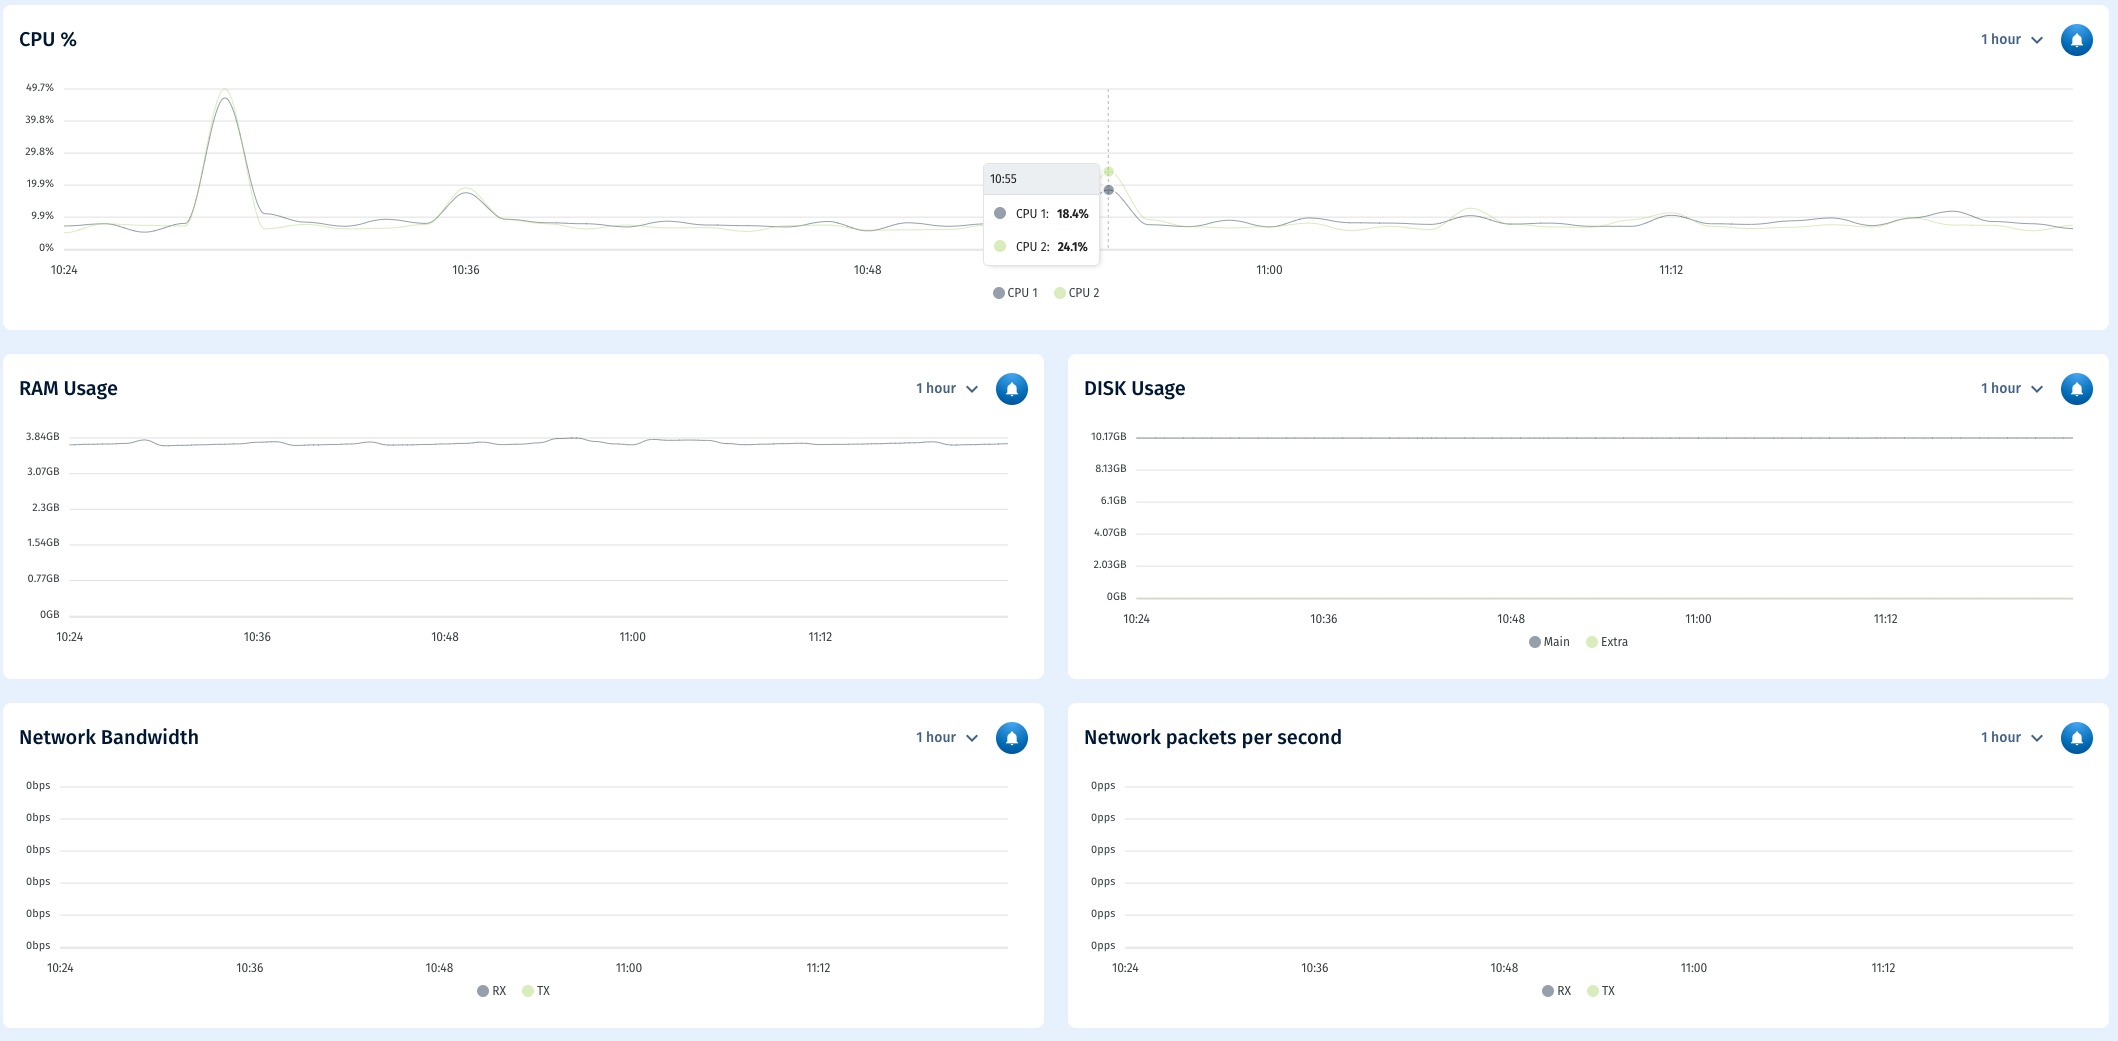
The following monitoring indicators can be chosen for your VM: CPU load, RAM usage, Main disk usage, Secondary disk usage, Network outgoing/incoming Gbps, and Network outgoing/incoming kpps. A monitoring metric is a standard for measuring a VM resource.
- CPU % - Average CPU(s) utilization in percentage.
- RAM Usage - RAM utilization in GB.
- DISK Usage - This measures how much disk space is currently used.
- Network Bandwidth - This is a measurement of incoming or outgoing traffic (Mbps) passing through the VM network interfaces.
- Network packets per second - This is a measurement of incoming or outgoing traffic of packets passing through the VM network interfaces.

Please note:
Monitoring metric available for 1 hour up to 30 days