Monitoring
What is Monitoring in the Dashboard used for?
Monitoring in the Dashboard is used for notifying you of problems or warnings about load, low disk space, or network traffic. You will receive notifications on the channel of your choice about disk space reduction, processor load, network traffic, and much more. Thus, you will be able to keep track of your instance.
How to set an alert in the Monitoring section?
To set an alert in the monitoring section, please follow the steps below:
- In the Dashboard section, choose Monitoring.
- Click on the New alert button and select the desired parameter to be monitored.
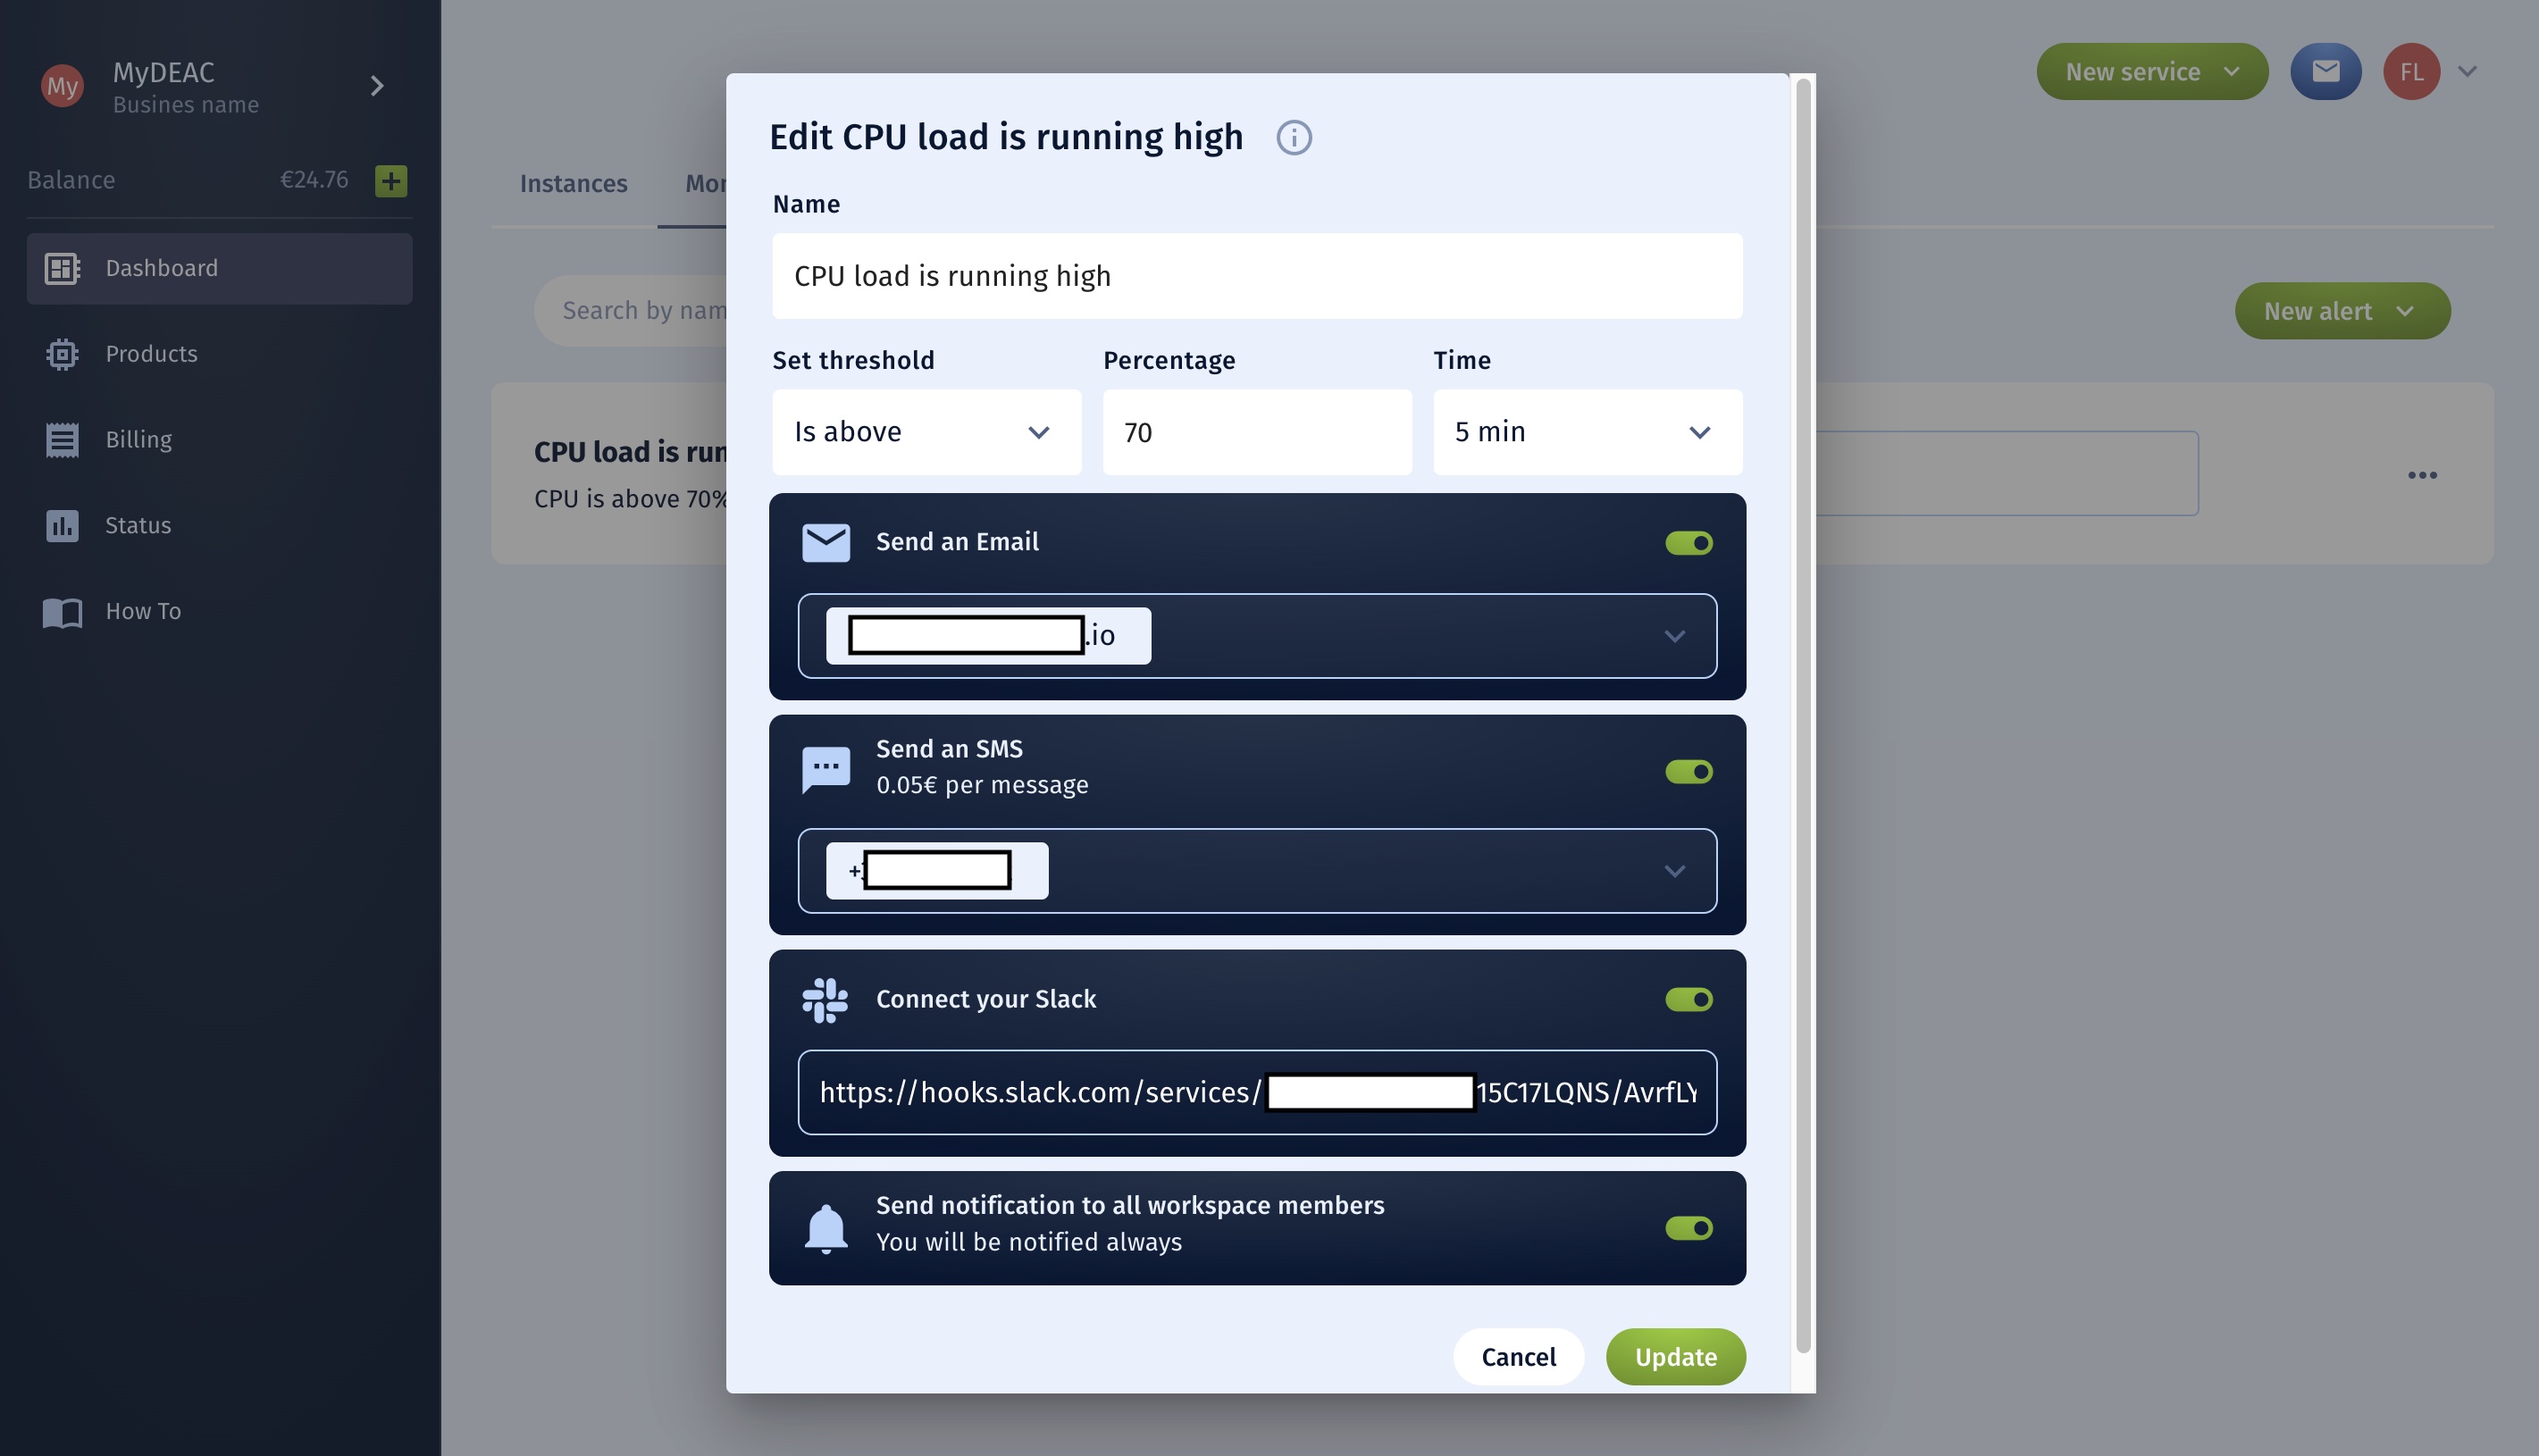
- Select the Name and the notification method, and set up your alert, at what values it will notify you.
- Set threshold value for CPU/RAM/SSD - Percentage, Network - Gbps and kpps.
- Add notification type, Send an Email, Send SMS, Connect your Slack and Send notification to all workspace members.
- Click on the Create button.
- Specify the desired instance (VM) for Monitoring in the already created alert.
- Click the Save button.
Example - CPU load above 70% in 5 minutes with all notification types.
What types of Monitoring is it possible to set?
It is possible to set these monitoring types to monitor the following parameters: CPU load, RAM usage, Main DISK usage, Extra DISK usage, Network outbound Gbps, Network inbound Gbps, Network outbound kpps, and Network inbound kpps.
What are the possible channels to receive alert messages?
To receive alert messages, you can use this channels: e-mail, sms, slack or just receiving notifications to all workspace members.
How to manage my alerts? (edit, delete)
To manage your alerts, please follow the steps below:
- In the Dashboard section, open the section Monitoring.
- Select the previously created alert and click on the menu (three dots).
- Click on Edit alert and assign new settings.